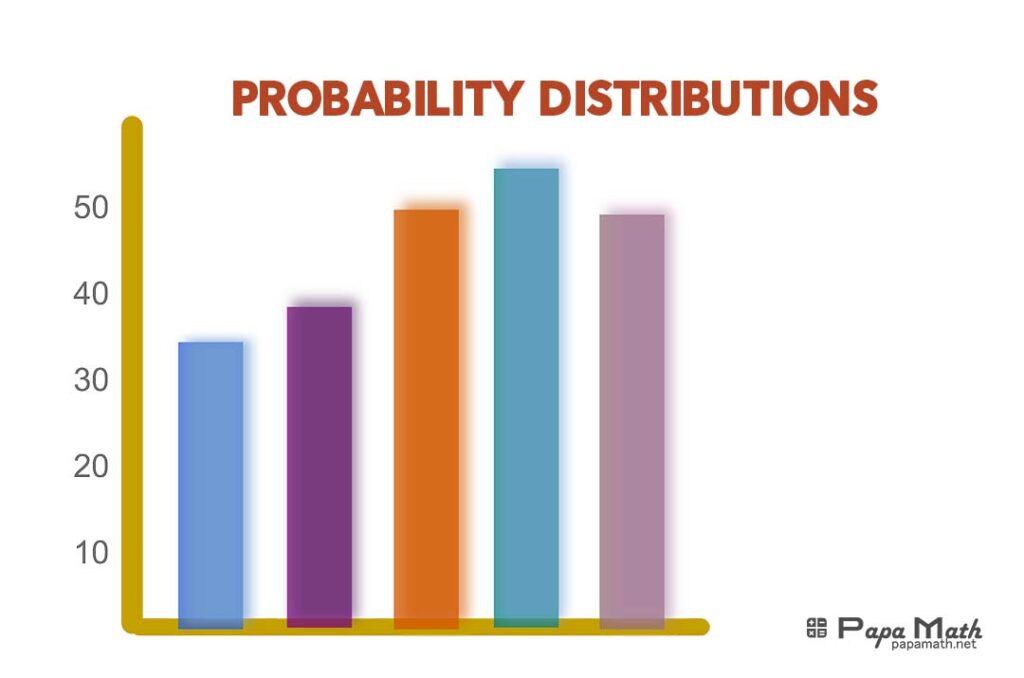
Probability distributions are fundamental concepts in statistics and probability theory. They provide a mathematical framework for understanding and quantifying the likelihood of various outcomes in a random experiment or process. This article delves into the world of probability distributions, exploring their different types, properties, and applications. We will also address common questions like “which of the following is a valid probability distribution” and guide you on how to graph a probability distribution.
What is a Probability Distribution?
At its core, a probability distribution describes the probabilities associated with each possible outcome of a random variable. It is a function that assigns probabilities to values within a specific range. The probability distribution of a random variable is called a distribution.
Properties of a Valid Probability Distribution
A valid probability distribution must adhere to the following properties:
Non-negativity
The probability of any outcome must be greater than or equal to zero (P(X) ≥ 0).
Normalization
The sum of the probabilities of all possible outcomes must equal 1 (∑P(X) = 1).
Additivity (for discrete distributions)
The probability of a set of mutually exclusive events is the sum of their individual probabilities.
Mean of a Probability Distribution: A Measure of Central Tendency
The mean of a probability distribution, often denoted by μ (mu), represents the expected value of the random variable. It is a measure of central tendency, indicating the average or “center” of the distribution. In other words, it tells us what outcome we can expect on average over the long run.
Different Types of Probability Distributions
Probability distributions come in various forms, each with its own characteristics and applications. Let’s explore some of the most common types:
Discrete Probability Distributions
Bernoulli Distribution: Models a single trial with two possible outcomes, often labeled “success” and “failure.” A coin flip is a classic example.
Binomial Distribution
Describes the number of successes in a fixed number of independent Bernoulli trials. For instance, the number of heads in ten coin flips follows a binomial distribution.
Poisson Distribution
Models the number of events occurring in a fixed interval of time or space, given a known average rate of occurrence. Examples include the number of customers arriving at a store in an hour or the number of typos in a document.
Geometric Distribution
Represents the number of trials needed to achieve the first success in a sequence of independent Bernoulli trials. An example is the number of dice rolls required to get a six.
Continuous Probability Distributions
Normal (Gaussian) Distribution
The most widely recognized distribution, characterized by its bell-shaped curve. It models many natural phenomena, such as heights, weights, and test scores.
Uniform Distribution
All outcomes within a specified range are equally likely. For instance, the time a bus arrives at a stop within a given interval follows a uniform distribution.
Exponential Distribution
Describes the time between events in a Poisson process. Examples include the time between customer arrivals or the lifespan of a lightbulb.
Graphing a Probability Distribution
Visualizing a probability distribution helps us understand its shape and characteristics. Here’s how to graph the two main types:
Discrete Distribution: Bar Graph
On the x-axis, plot the possible values of the random variable.
On the y-axis, plot the corresponding probabilities.
Draw a vertical bar for each value, with the height representing the probability.
Continuous Distribution: Curve
On the x-axis, represent the range of values the random variable can take.
On the y-axis, plotthe probability density function (PDF).
Draw a smooth curve that connects the points on the graph, representing the PDF. The area under the curve within any interval represents the probability of the random variable falling within that interval.
Real-World Applications of Probability Distributions
Probability distributions are invaluable tools in various fields, including:
Insurance
Actuaries use probability distributions to model risk and calculate premiums.
Finance
Analysts employ distributions to assess investment risk and predict market behavior.
Quality Control
Manufacturers use distributions to monitor product defects and ensure consistency.
Medicine
Researchers utilize distributions to analyze clinical trial data and evaluate treatment effectiveness.
Compare and Contrast: Discrete vs. Continuous Distributions
| Feature | Discrete Distribution | Continuous Distribution |
|---|---|---|
| Type of random variable | Discrete (takes specific values) | Continuous (takes any value within a range) |
| Probability function | Probability mass function (PMF) | Probability density function (PDF) |
| Examples | Bernoulli, binomial, Poisson, geometric | Normal, uniform, exponential |
| Visualization | Bar graph | Curve |
To learn more about the concept of frequency, read the article What is Frequency?
FAQs
Which of the following is a valid probability distribution?
To determine if a given set of values represents a valid probability distribution, check if it satisfies the properties of non-negativity and normalization.
How do you compare and contrast different types of distributions?
Consider factors such as the type of random variable (discrete or continuous), the shape of the distribution (symmetric, skewed), and the parameters that define it (mean, variance).
For a deeper understanding of probability distributions and their applications, read the article “Demystifying Probability Distributions: A Comprehensive Guide.“
Conclusion
Probability distributions are powerful mathematical tools that enable us to understand and quantify uncertainty. By grasping the concepts presented in this article, you can confidently navigate the world of probability distributions and apply them to real-world scenarios. Whether you are a student, researcher, or professional, understanding probability distributions will undoubtedly enhance your analytical skills and decision-making abilities.
I hope this comprehensive guide has shed light on the fascinating world of probability distributions. If you have any further questions or would like to explore specific distributions in more detail, feel free to ask!

